How do you calculate ROAS?
ROAS = attributed revenue ÷ advertising spend. Multiply the ratio by 100% to express it as a percentage. Use the same currency, reporting period, and campaign scope on both sides of the calculation. Otherwise, a mathematically correct result can still be misleading.
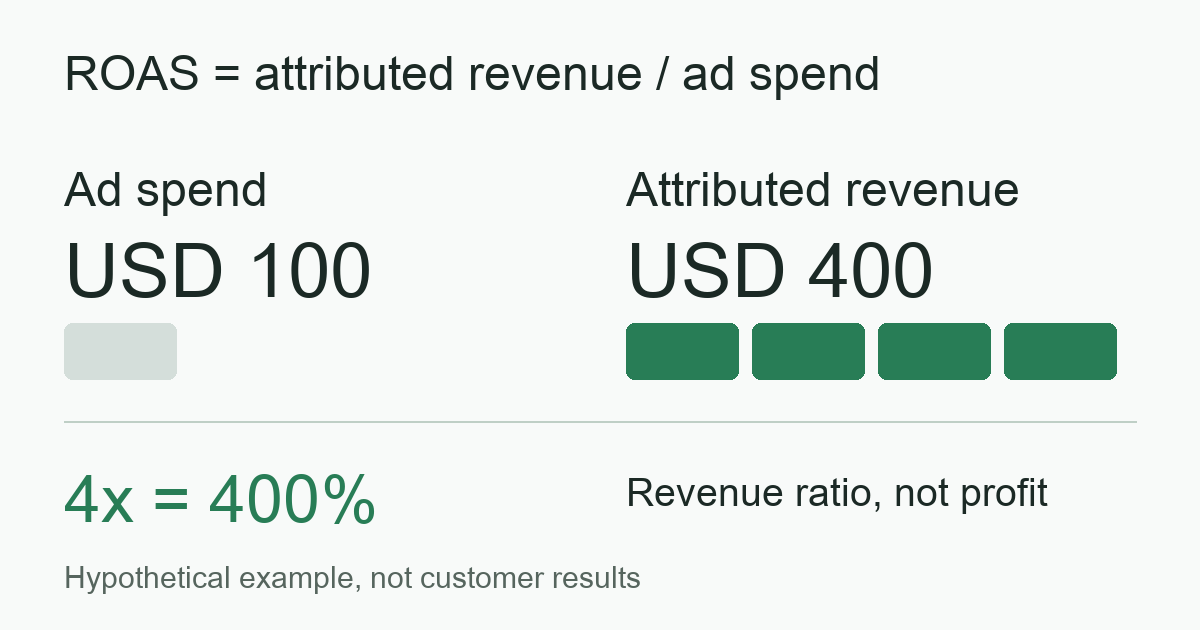
Suppose a campaign spends USD 100 and produces USD 400 in revenue under your chosen attribution rules. The calculation is 400 ÷ 100 = 4. A 4x ROAS and a 400% ROAS express the same ratio. A 4% ROAS is only 0.04x, a hundredfold difference. These are hypothetical teaching figures, not MeetROAS customer results.
Google Ads describes the ratio in terms of conversion value relative to cost in its Target ROAS guide. But conversion value is something you configure. If the value represents an estimated lead value, label the report accordingly; it is not automatically realized revenue.
How is ROAS different from ROI?
ROAS asks how much attributed revenue corresponds to each dollar of advertising spend. ROI asks what the return looks like after the relevant investment costs. ROAS does not automatically deduct product costs, payment fees, fulfillment, staff, or software.
| Metric | Simplified calculation | Question it answers |
|---|---|---|
| ROAS | Attributed revenue ÷ ad spend | How efficiently does advertising produce revenue? |
| ROI | Net return ÷ relevant total investment | What is the return after the relevant costs? |
Continue the example: revenue is USD 400, product and fulfillment costs total USD 240, and advertising costs USD 100. The return before allocating fixed costs is USD 60. If the relevant investment includes those USD 340 in costs, simplified ROI is 60 ÷ 340, or approximately 17.6%. ROAS remains 4x. The numbers differ because they answer different questions.
Google's ROI explanation also brings costs into the calculation. Define the cost basis for your own reporting before comparing periods. Adding fixed costs in one month and excluding them in another makes the comparison unreliable.
What is a good ROAS?
There is no universal good ROAS. Start with the share of revenue remaining after variable costs but before advertising. This is the contribution margin available to cover acquisition and other costs. At a 40% contribution margin, a simplified break-even ROAS is 1 ÷ 0.4 = 2.5x.
That threshold depends on the assumptions in this example: consistent revenue and cost definitions, similar contribution margins across orders, and no allocation of fixed costs. Refunds, discounts, support costs, or fixed overhead can raise the required threshold. A 2.5x ratio is not an industry benchmark. First-purchase ROAS and a value that includes future repeat purchases are also different measurement bases.
A higher ratio does not always mean a better business outcome. A campaign spending USD 100 and generating USD 500 has a higher ROAS than one spending USD 1,000 and generating USD 4,000. The second campaign could still contribute more total return. Consider revenue scale, margin, budget, and data reliability alongside the ratio.
Why do two ROAS reports disagree?
Check the measurement definitions before drawing a performance conclusion. Common differences include:
- Attribution windows. One report may include purchases seven days after a click while another includes only same-day purchases. Delayed conversions widen the difference.
- Date basis. Reporting by click date versus purchase date can shift revenue between weeks. Different time zones can also move the boundary of a day.
- Revenue scope. Tax-inclusive sales, sales before refunds, and net revenue should not be treated as interchangeable.
- Incomplete spend. Missing advertising costs inflate the ratio. Missing cost data should mean unavailable, rather than zero-cost traffic.
- Missing or duplicate events. A lost purchase understates revenue. A retried order without deduplication can overstate it.
- Proxy values. Assigning a fixed value to a lead, registration, or install can serve a particular optimization goal, but does not establish cash revenue of that amount.
Attribution allocates outcomes to touchpoints according to rules. It does not establish that a purchase would never have happened without the ad. Measuring additional revenue caused by advertising requires a suitable control group, holdout, or other incrementality experiment.
How can ROAS guide an investigation?
Look beyond the final ratio. Break the journey into ad clicks, page views, install intent or registration, first opens, and downstream events that actually carry value. Many clicks but few registrations may point to a mismatch between the audience and the landing page. Many registrations but few purchases call for an investigation of downstream quality and event coverage.
For example, a campaign produces 200 measured registrations but has no purchase feed. The defensible conclusion is that you can currently evaluate registration cost. You cannot conclude that revenue is zero. Missing data and missing performance are different problems.
MeetROAS campaign pages and downstream events can help compare these stages. The information available depends on the sources, events, and spend you actually connect. Install or first-open counts alone cannot establish revenue ROAS. Start with the guide to choosing a post-click landing page, then review the event integration guide in the Developer Hub.
Five checks before reading the report
- Define revenue or conversion value, including refunds, tax, and discounts.
- Align campaign scope, currency, time zone, date basis, and attribution window.
- Confirm complete spend coverage and allow an appropriate conversion-reporting delay.
- Check order or event identifiers for duplicates, and reconcile missing totals against the destination system.
- Set a threshold based on margin and costs, then compare campaigns using mature data.
Frequently asked questions
Does 400% ROAS mean four times the profit?
No. It means attributed revenue is four times advertising spend. Profit depends on product, operating, and other relevant costs.
Can I calculate ROAS without revenue data?
You cannot calculate realized revenue ROAS. Use measurements you have, such as CPA or registration rate. If you use estimated values, clearly label them as estimated conversion value.
Can ROAS be zero or negative?
With positive ad spend and zero attributed revenue, ROAS is zero. Under a net revenue definition, refund adjustments can produce negative revenue and a negative ratio; preserve that explanation. With zero ad spend, the formula does not produce a meaningful finite ratio, so report it as not applicable.
Should I increase budget whenever ROAS is high?
Not automatically. Check data maturity, cost coverage, and sample size first. Then evaluate marginal performance as spend increases. The current average does not guarantee the same ratio on additional budget.
Sources
- Google Ads: About Target ROAS bidding — Checked: 2026-10-08
- Google Ads: Calculate your return on investment — Checked: 2026-10-08
- Google Ads: About conversion values — Checked: 2026-10-08