Start with one question about your buyers
Suppose you manage a coffee store's paid campaigns. One source brings in cheaper first-time buyers. Another costs more and brings in buyers who often reorder. You need to know how much each group has contributed by the time you can afford to reinvest. Begin with completed order records and compare buyers at the same age since their first qualifying purchase.
Customer lifetime value (LTV or CLV) estimates what a customer is worth over the business relationship. A measured 90-day value uses what the group has generated so far. A 12-month forecast adds assumptions about later orders, refunds and costs. Keep the horizon and whether the number is revenue or contribution in the label. Shopify on historical and predicted customer lifetime value
Calculate value from a fixed group of first-time buyers
A cohort is a group defined by the same starting condition. Here it is customers who made their first qualifying paid order in the same acquisition period. Assign each buyer to one source under a stated attribution rule, keep an unknown group for buyers you cannot match, and follow all buyers in each group. The denominator includes customers who never place a second order.
- 90-day revenue per buyer = net revenue from eligible orders through day 90 ÷ original buyers. Include first orders and later orders in the window. Apply discounts and known refunds once and use a consistent treatment for tax and shipping.
- 90-day contribution per buyer before acquisition = (net revenue − order-related variable costs) ÷ original buyers. Define those costs, such as goods, fulfillment and payment processing. Keep acquisition expenses out of this numerator when you will subtract them later.
- Customer acquisition cost (CAC) = acquisition costs assigned to the cohort ÷ original buyers. Document which ad, sales and marketing costs you included and how you allocated any shared expenses.
Average order value (AOV) divides by orders. If a customer buys three times, all three eligible orders feed the revenue numerator, while that buyer appears once in the LTV denominator. See the AOV example · Shopify customer cohort reports
Work through two hypothetical sources
Each source acquired 100 first-time buyers. Everyone has a complete 90-day window starting at their first paid order. Amounts below are in USD per original buyer and exclude tax and fixed overhead. Acquisition costs use the same scope for both sources.
| At day 90, USD per buyer | Source A | Source B |
|---|---|---|
| Net revenue | 100 | 150 |
| Variable costs | 70 | 80 |
| Contribution before CAC | 30 | 70 |
| CAC | 40 | 60 |
| Contribution after CAC | −10 | +10 |
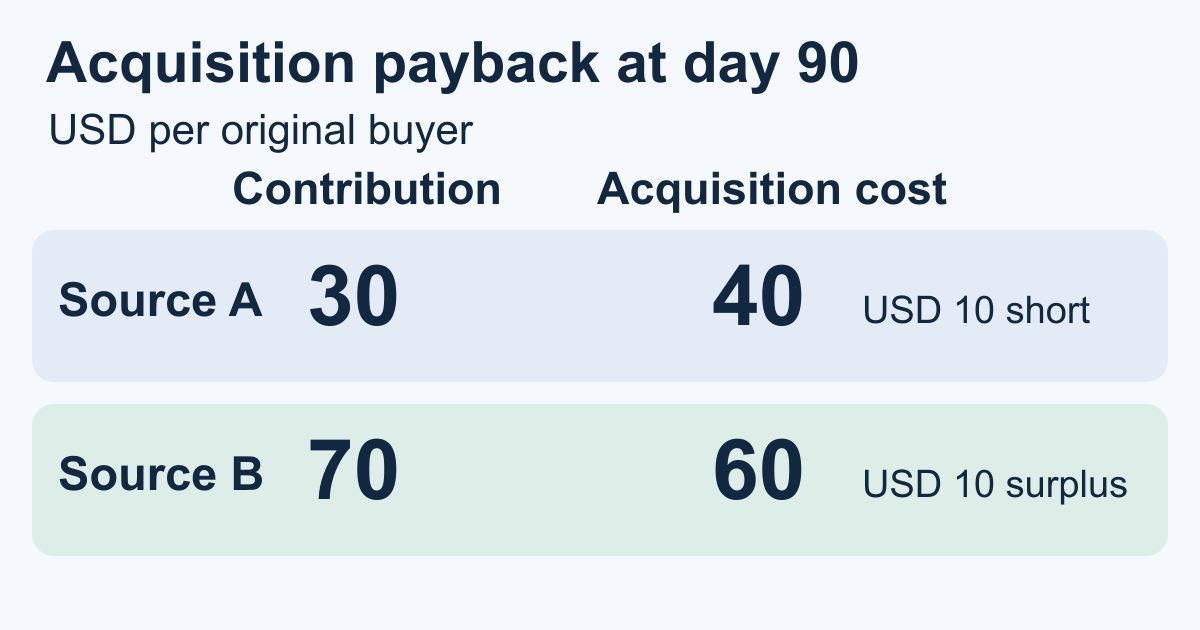
Both revenue-to-CAC ratios are 2.5×. The measured contribution-to-CAC ratios are 0.75× for A (30 ÷ 40) and about 1.17× for B (70 ÷ 60). A still needs USD 10 per buyer to recover its acquisition cost on this basis. B covers that cost and leaves USD 10 per buyer before fixed overhead. How to reconcile order revenue and reported conversion value
Check when the cost was recovered
Keep cumulative contribution checkpoints for the cohort. In this example, B has USD 20 by day 30, USD 47 by day 60 and USD 70 by day 90. B first exceeds its USD 60 CAC at the day-90 checkpoint. Those three observations give you a checkpoint result. Use a finer ledger to locate the crossing and check whether later refunds reverse it. A is still below CAC at day 90, so its payback date remains unknown. Stripe describes a simple monthly payback estimate. With uneven orders and costs, use the cumulative series for the observed cohort. Stripe on acquisition-cost payback
If you need to decide whether you have cash to buy another round of ads, also record when payments settle and when you pay suppliers, processors and acquisition bills. Contribution calculated from orders and variable costs can cross the threshold before or after the cash balance does.
Keep a forecast alongside what you observed
For a 12-month estimate, start with mature comparable cohorts and state the expected repeat purchase pattern, cost changes and refunds. Show a downside and a base case, then compare them with actual results as the new cohort ages. Older buyers may have arrived under different offers or prices. A new acquisition source may have a different repeat pattern. When history is thin, start with a measured horizon and leave later contribution uncertain.
Check the unit before copying a platform value. For example, GA4's Average 120d value measures average revenue generated by new users during their first 120 days. This store uses first-time paying customers and subtracts variable costs for its contribution measure. Changing either the starting event or the cost scope changes the comparison. GA4 retention report
Use the result to choose the next test
- Pick a decision horizon that matches the buying cycle and cash needs. Compare 30-day groups with other 30-day groups and wait for both to reach 90 days before comparing those results. Give late refunds the same follow-up in both groups.
- Reconcile eligible orders, customer IDs and source assignment before averaging. Report sample size and the unmatched share. Check whether one large order or a changed product mix drives the average.
- For A, investigate first-order margins or weak repeat purchasing before increasing acquisition. For B, check whether buyers acquired at a higher budget behave similarly. The original cohorts were observational, so a controlled test is useful if the spend decision depends on the effect of a change.
When a connected destination reports completed registration, MeetROAS can link that event to an eligible campaign click. Use that context to investigate where a source group begins and reconcile paid buyers, repeat purchases, refunds and costs in your own records. MeetROAS destination event reference
Sources
- Shopify: Customer Lifetime Value — Checked: 2026-11-11
- Stripe: CAC Payback Period — Checked: 2026-11-11
- Shopify Help Center: Customers reports — Checked: 2026-11-11
- Google Analytics: Retention overview report — Checked: 2026-11-11
- MeetROAS Developers: Partner Event API reference — Checked: 2026-11-11