AOV measures a basket, not a customer
Average order value (AOV) is the chosen revenue amount divided by the number of orders in the same scope and period. It answers “How much did an order contain on average?” It does not answer how many people bought, how much a customer will spend over a lifetime, or whether advertising was profitable.
A buyer can place two orders. That creates two order denominators, but only one buyer. Shopify's AOV guide defines the revenue-per-order calculation and cautions that increasing the average does not automatically increase profit. Before trying a bundle or free-shipping threshold, check whether more money per basket compensates for any lost orders and added costs.
A larger basket can accompany less revenue
Consider two hypothetical traffic sources for the same store during one completed week in Asia/Taipei. These are teaching numbers, not customer results or a controlled experiment. Count distinct paid orders once, after discounts; exclude cancelled and test orders. All amounts are USD, with tax and shipping excluded. Assume these orders have no refunds at the review date; later refunds require a refreshed reconciliation.
| Source | Paid orders | Merchandise amount | AOV |
|---|---|---|---|
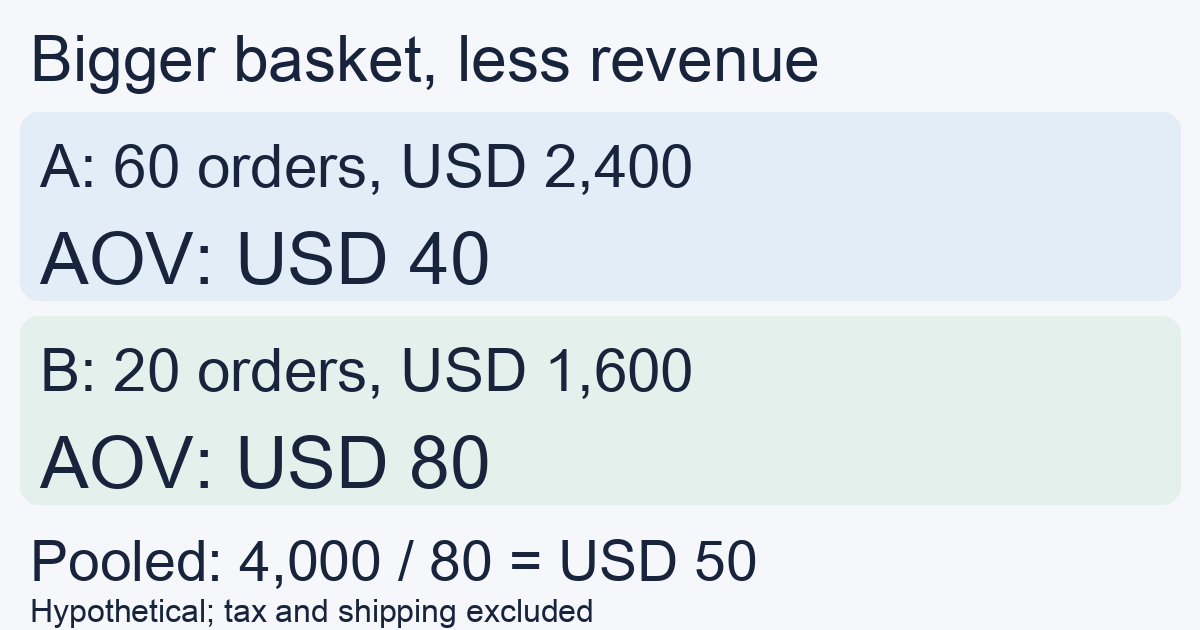
| A | 60 | USD 2,400 | USD 40 |
| B | 20 | USD 1,600 | USD 80 |
Source A's AOV = 2,400 ÷ 60 = USD 40 per order. Source B's AOV = 1,600 ÷ 20 = USD 80 per order. B has twice the AOV, yet less merchandise revenue in this example. Its 20 larger orders do not outweigh A's 60 smaller ones.
That still does not establish that A is more profitable. We have no ad cost, product cost, payment fee or fulfillment-cost data here. Nor does it prove a bundle caused B's larger basket: the sources may bring different customers or sell different products. Use ROAS for an aligned revenue-to-ad-spend question and profit on ad spend when evaluating a declared contribution basis. AOV supplies one part of the picture.
Pool orders before averaging sources
The combined AOV is (2,400 + 1,600) ÷ (60 + 20) = USD 50 across 80 orders. Taking the simple average of USD 40 and USD 80 gives USD 60, which is wrong for this pooled order set: it gives the 20-order source the same weight as the 60-order source.
The practical rule is to add comparable revenue amounts and order counts first, then divide. Equivalently, weight each source's AOV by its order count. Check that the groups are mutually exclusive before pooling; the same order attributed to two platforms cannot become two store orders. If currencies or accounting scopes differ, standardize them before combining numbers.
A few very large baskets can also raise the mean while most orders stay small. Inspect the median order, common basket sizes and the product mix alongside AOV. Those checks help distinguish a broad change in buying behavior from one exceptional order; they do not turn a small sample into a reliable experiment.
Decide what revenue and an order mean
An AOV label is incomplete without its scope. Write down whether the numerator includes discounts, refunds, tax and shipping, and what happens to cancelled, partly refunded or fully refunded orders in the denominator. There is no benefit in comparing one report's pre-refund amount with another's after-refund amount and calling the difference better performance.
For a separate hypothetical example, start with 10 paid orders totaling USD 1,000 after discounts, excluding tax and shipping. One order later receives a USD 200 refund. If the stated measure is after-refund merchandise amount per original paid order, it is (1,000 − 200) ÷ 10 = USD 80. The denominator remains 10 by that explicitly chosen rule. If another report removes fully refunded orders, reconcile its numerator and denominator together before comparing it. Do not silently alternate rules.
Google Analytics' metric reference distinguishes average purchase revenue from revenue per paying user and per active user. It also defines purchase revenue after refunded transaction revenue, while its ecommerce-purchases metric counts purchase events and excludes certain other purchase-event types. Do not assume that dividing two similarly named exported columns recreates the platform's AOV across every web and app event family. Verify the metric definitions and your event scope.
An assigned lead value is another mismatch: ten leads valued at USD 100 each are not ten paid orders. Review conversion value versus revenue before putting a tracking value into an order calculation. An absent order count makes AOV unavailable; zero orders does not produce a meaningful USD 0 AOV.
Test a basket change with business guardrails
Start with a concrete hypothesis: for example, a clearly priced bundle could increase relevant items per purchase without reducing completed orders enough to lower contribution. Keep one consistent currency, order definition and review period, then:
- Record a baseline of orders, AOV, total merchandise amount, conversion rate, refunds and contribution under a stated cost scope. Segment source and product mix when they differ materially.
- If testing two page versions, use comparable eligible traffic and a defined allocation. Do not treat yesterday's source A versus today's source B as a controlled test.
- Let the chosen conversion window mature, then reconcile payments and known refunds. Report delayed refunds separately and refresh the result when they arrive.
- Judge the change against the business objective. A higher AOV with fewer orders or expensive shipping subsidies can fail a contribution goal. Do not declare a winner from a handful of orders or stop the test because one large purchase arrives.
MeetROAS can connect supported destination business events to their originating campaign through its documented event handoff. That attribution context can help organize a source comparison; the merchant must still reconcile genuine orders, amounts and refunds. It is not a substitute for an order ledger or proof that a reported event value is order revenue.
What is a good AOV?
There is no universal target independent of product, price, margin and purchase frequency. Compare like-for-like periods and segments, and ask what changed in the basket and the number of completed orders. A high-ticket source can reasonably have higher AOV and fewer orders; a lower-price source can contribute more total revenue.
For the worked example, the useful conclusion is precise: B's basket is larger, A has more orders and more merchandise revenue, and the pooled AOV is USD 50. Profitability and the effect of changing a page remain unknown. That is enough to choose the next data check without turning a single average into a budget decision.
Sources
- Shopify: Average Order Value: Formula and 7 Ways — Checked: 2026-11-05
- Google Analytics Data API: Metrics schema — Checked: 2026-11-05
- MeetROAS: Partner Event API reference — Checked: 2026-11-05