What is conversion rate? Name who completes what
Conversion rate, or CVR, is completed goals / corresponding starting units × 100%, within a stated scope. “15% conversion rate” leaves an important question unanswered: does it describe arrivals that become registrations, or registered people who make a first payment? Naming it “arrival-to-registration rate” tells a reader which part of the journey it can help diagnose.
A conversion is a defined completed outcome, such as a valid lead, completed registration, or first payment. A button click need not represent that outcome. A funnel breaks acquisition into steps. Unlike ad CTR, which measures impressions turning into clicks, conversion rate usually examines whether a specified goal follows the click.
Platform columns with the same name can use different denominators. Google Ads defines conversion rate using conversions divided by ad interactions that can be tracked to a conversion in the same period. Those interactions need not all be clicks. Its percentage is not automatically your website's arrival-to-registration rate.
One group of traffic, four different answers
All figures here are hypothetical teaching data, not customer results. A campaign receives 1,000 ad clicks during one week in the Asia/Taipei time zone. Assume each person clicks once. Of those people, 800 arrive successfully, each with one visit; 120 complete registration, and 30 of those registered people make a first payment. Every outcome links to these clicks, with no other sources or existing customers included. Count each step at most once per person. Use the same seven-day click window and wait until the final clicks have completed it.
| Funnel step | Numerator / denominator × 100% | What to check next |
|---|---|---|
| Click → arrival | 800 / 1,000 = 80% | Loading and redirects |
| Arrival → registration | 120 / 800 = 15% | Page promise and sign-up flow |
| Registration → first pay | 30 / 120 = 25% | Price, payment, and demand |
| Click → first pay | 30 / 1,000 = 3% | Overall outcomes and cost |
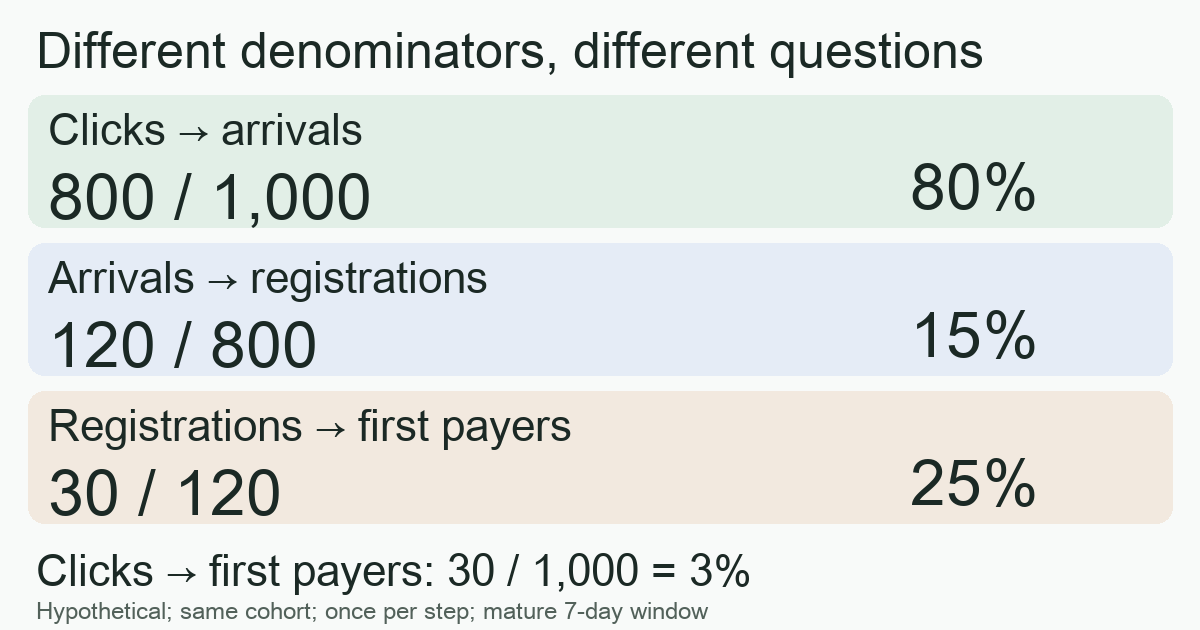
Both 120 / 800 = 15% and 120 / 1,000 = 12% are correct. The latter is a click-to-registration rate. Comparing that 12% with another report's arrival-based 15% does not establish a decline: the denominator changed.
Multiplying 80% × 15% × 25% produces the final 3% here because the steps follow the same group, in order, once per person. Do not multiply rates from reports mixing repeat visits, multiple orders, attribution sources, or periods. These figures identify stages to investigate; they do not establish a broken page or poor traffic quality by themselves.
Clicks, visits, page views, and people are different units
One ad click does not guarantee a successful arrival. One person can click repeatedly, return tomorrow, or view several pages during one visit. Reloading a page can produce another page view. Page views therefore do not count distinct visitors. Our example excludes repetition deliberately; actual analysis needs the tool's counting and identity rules.
GA4's official metric definitions distinguish session key event rate from user key event rate. The first measures the share of sessions with the goal; the second measures the share of users with the goal. A session is a visit grouped according to the tool's rules. A key event is an event marked as an important outcome.
Consider a separate hypothetical example. Among 100 sessions, three sessions each contain one buyer making two orders: six orders in total. Orders / sessions is 6%, describing average order volume per session. Sessions containing a purchase / all sessions is 3%, describing the share of purchasing sessions. Calculating a user-based rate also requires the corresponding user total; 100 sessions cannot simply be assumed to mean 100 people.
Check these interpretations before celebrating an increase
Adding goals does not count more customers. One person registering and then paying can generate two conversions. Google Ads also notes that multiple actions or “Every” counting can produce a conversion rate above 100%. If the question concerns first-time payers, use the corresponding people for that goal rather than adding every event.
Zero, missing, and immature are different. With 100 confirmed arrivals, complete tracking, and no registrations, registration rate is 0%. A zero denominator makes the rate undefined. An interrupted registration feed makes data incomplete. Yesterday's clicks still have time to convert; comparing them with older traffic that completed its window can mislead.
Do not average percentages directly. A has 10 arrivals and two registrations; B has 90 arrivals and nine registrations. Combined rate is 11 / 100 = 11%, rather than the 15% simple average of 20% and 10%. Even correct pooling can hide changes in audience or device mix. Compare similar groups first.
Turn a rate into a useful next action
- Name the outcome and starting point. Write “arrival-to-completed-registration rate for this traffic group.” Keep raw counts, dates, time zone, window, and deduplication rules so someone else can reproduce it.
- Reconcile before diagnosing abandonment. Compare tracking with completed records at the destination. Few arrivals call for checking links and loading; few registrations call for examining the flow. Missing tracking cannot simply be treated as missing outcomes.
- Test a specific step. If arrivals look normal but few registrations finish, inspect the mobile form, then test one field or explanation. Preserve audience and other conditions instead of changing everything at once.
- Check cost and downstream value too. With USD 300 spend, the example's first-payment CPA is 300 / 30 = USD 10. More registrations without more first-time payers do not justify increasing budget on registration rate alone. Pair the rate with CPA for the specified goal and ROAS's revenue scope. Mark incomplete cost or revenue as unavailable.
For a step-by-step investigation, use the campaign funnel worksheet. It distinguishes required steps from optional routes, so a customer who registers without installing is not mislabeled as a failed registration.
For products with registration and deposit flows, MeetROAS campaign pages and connected downstream events can help separate post-arrival outcomes. Its event documentation distinguishes completed registration from a first effective deposit; the destination still needs to send those facts. Page views include reloads and cannot simply stand in for unique visitors or ad-source clicks.
Frequently asked questions
What is a good conversion rate?
First fix the goal and denominator, then compare similar products, sources, devices, and mature periods. A 15% registration rate and a 3% first-payment rate answer different questions. There is no universal passing score across those journeys, and small raw counts do not establish a winner.
Does a higher conversion rate mean more profitable advertising?
Not necessarily. Cost, order value, refunds, and downstream quality can change. Confirm the goal and tracking first, then examine completed volume, CPA, and available revenue within the same scope. The percentage explains one part of that result.
Sources
- Google Ads: Conversion rate: Definition — Checked: 2026-10-15
- Google Analytics Data API: Session and user key event rate definitions — Checked: 2026-10-15
- MeetROAS Developer Hub: Partner Event API and event catalog — Checked: 2026-10-15