What is CTR? Start with the numerator and denominator
CTR, or click-through rate, is ad clicks / corresponding ad impressions, expressed as a percentage. If 10,000 impressions produce 200 clicks, CTR is 2%. It measures the share of ad impressions that produce a click. It does not establish successful arrivals, purchases, or revenue on its own.
Google Ads defines CTR this way and explains that a good CTR depends on the product and advertising network. Search and display ads face different intent and placements; one percentage cannot serve as a universal passing score.
Impressions and clicks are counts, not unique people. One person may see or click an ad repeatedly, so 200 clicks do not mean 200 new customers. This article covers ad CTR, rather than an on-site button click rate. A button rate might use page visits or button exposures as its denominator. Name that separately instead of substituting it for the ad report's CTR. For the denominator after a click, see conversion rates for each funnel stage.
Twice the CTR, half the orders
Everything below is hypothetical teaching data, not customer results. A and B promote the same product and page, each spending USD 100 for 10,000 ad impressions. Compare the same week, time zone, and currency with the same seven-day click attribution window. Wait until the last day's clicks have completed that window. All orders are paid, with at most one order per person and per click, no other goal, and no view-through attribution. Each order contributes USD 40 revenue. There are no refunds in this example, and revenue excludes deductions for product and operating costs.
| Metric | Campaign A | Campaign B |
|---|---|---|
| Spend / impressions | USD 100 / 10,000 | USD 100 / 10,000 |
| Ad clicks | 200 | 400 |
| CTR | 200 / 10,000 = 2% | 400 / 10,000 = 4% |
| Paid orders | 10 | 5 |
| Click-to-order rate | 10 / 200 = 5% | 5 / 400 = 1.25% |
| Average CPC (spend / clicks) | USD 0.50 | USD 0.25 |
| Order CPA (spend / orders) | USD 10 | USD 20 |
| Attributed revenue | USD 400 | USD 200 |
| ROAS (attributed revenue / spend) | 4× | 2× |
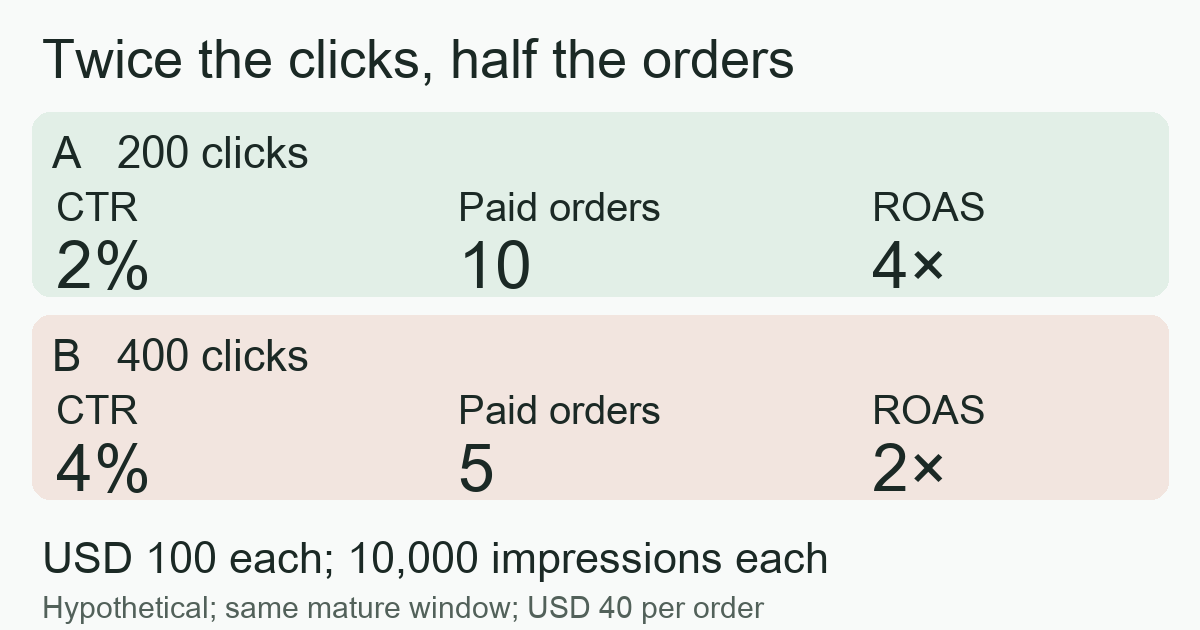
B gets twice as many clicks, a higher CTR, and a lower CPC. Yet fewer clicks produce an order, doubling order CPA and halving ROAS. Choosing creative solely by CTR could favor the ad that attracts clicks without delivering more completed outcomes. These small samples do not establish a stable winner or prove that high CTR causes poor sales. They identify two stages to investigate separately.
Average CPC measures click cost, while CPA measures cost per specified action. The Google average CPA definition also uses conversions as the denominator. ROAS compares revenue with spend, and still does not directly measure profit.
Two rates answer two different questions
Impression to click: whom did the ad attract? If CTR is low, inspect whether the creative is understandable, the audience relevant, and the placement appropriate. If CTR rises, also check the accuracy of the promise. An ad that makes a product seem free, followed by a page revealing a price, might attract people without purchase intent. That is an explanation to test, rather than a cause established by the report.
Click to completion: why did these visitors stop? Check whether the product, price, and offer match across the ad and page, whether mobile visitors can complete the flow, and whether payment or event delivery failed. Google's landing-page guidance also emphasizes matching the page to the ad's promise. Reconcile against actual completed records before mistaking missing events for poor traffic.
The example's click-to-order rate uses paid orders from this click cohort only. Google's conversion-rate definition uses ad interactions that can be tracked to a conversion, which may include more than clicks depending on format. Do not import a platform conversion rate with a different denominator into this example, or substitute video views for ad clicks.
Three mistakes that distort the result
A high percentage can come from very few clicks. A has 10 impressions and two clicks, giving 20% CTR; B has 10,000 impressions and 200 clicks, giving 2%. A's higher percentage contains very little data and does not establish better creative. Examine raw counts and test conditions, then wait for enough outcomes.
Averaging CTRs directly. Suppose A has 100 impressions and 10 clicks, while B has 900 impressions and nine clicks. Their CTRs are 10% and 1%. Combined CTR is 19 / 1,000 = 1.9%, rather than their simple average of 5.5%. Even a correctly pooled rate can hide changes in placement, audience, or device mix. Examine comparable groups first.
Treating different events as the same success. Button clicks, arrivals, and paid orders are different outcomes. Zero impressions makes CTR undefined; missing impressions means insufficient data. Zero orders makes CPA undefined, rather than free acquisition. Recent, immature conversions also cannot be compared directly with an older campaign that has completed its attribution window.
A practical sequence for media buyers
- Define the final outcome. Measure orders, valid leads, or first payments separately. Do not substitute ad clicks for completion.
- Fix the comparison scope. Where possible, compare creatives within the same source, format, audience, device, and period. Record currency, time zone, attribution, and counting rules. Separate mixed groups before choosing a winner from total CTR.
- Show raw counts and both stages. Keep impressions, clicks, arrivals, completions, spend, and available revenue. Calculate CTR, click-to-goal rate, and CPA; mark missing cost or events as unavailable.
- Validate one specific explanation. Many clicks but few arrivals calls for checking destination loading. Few completions after arrival calls for checking the promise, flow, and event feed. High CTR with few orders does not itself establish fraud.
- Change one thing and observe. For example, clarify the price in the ad while keeping page, audience, and goal unchanged. CTR might fall while mature CPA and order quality improve. That is a testable hypothesis, not a promised result.
For products with registration and deposit flows, MeetROAS campaign pages and connected downstream events can help observe whether acquired traffic continues after arrival. Its event documentation defines completed registration and first deposit separately; the destination still needs to send the actual events. Ad CTR needs impressions and clicks from the corresponding advertising report, rather than page views.
Frequently asked questions
Does a higher CTR justify increasing budget?
First examine mature CPA for the same goal, completed volume, and downstream value. Higher CTR with a lower completion rate can deliver fewer outcomes. Small samples and changes in delivery mix also require further investigation.
Is moving from 2% to 4% an increase of 2%?
It is an increase of two percentage points, or a 100% relative increase: the rate doubled. State the baseline, impression count, and click count so percentage points are not confused with relative growth.
Sources
- Google Ads: Clickthrough rate (CTR): Definition — Checked: 2026-10-14
- Google Ads: Average CPA: Definition — Checked: 2026-10-14
- Google Ads: Conversion rate: Definition — Checked: 2026-10-14
- Google Ads: Optimize your ads and landing pages — Checked: 2026-10-14
- MeetROAS Developer Hub: Partner Event API and event catalog — Checked: 2026-10-14