CPC, CPA and ROAS answer different questions
CPC means cost per click. Average CPC is total cost of the corresponding clicks / number of those clicks, in money per ad click. Spending USD 120 on 600 clicks gives USD 0.20 CPC. Google Ads distinguishes this observed average from your maximum CPC bid; neither is the campaign budget.
| Metric | Question | Calculation | What it cannot establish alone |
|---|---|---|---|
| Average CPC | What did one ad click cost? | Ad spend / ad clicks | A completed registration or payment |
| Registration CPA | What did one completed registration cost? | Ad spend / completed registrations | Whether those registrants paid |
| Revenue ROAS | How much attributed revenue corresponds to each ad dollar? | Attributed net revenue / ad spend | Profit after product and other costs |
The CPA definition counts conversions rather than clicks. Here, “registration CPA” names that action explicitly. Google's Target ROAS uses conversion value relative to cost; our revenue ROAS requires measured revenue, not an assigned registration value. You cannot compare USD 0.20 CPC directly with 2x ROAS: their units and questions differ.
Clicks are not unique visitors or guaranteed page arrivals. CPC can describe a charging model too; a campaign billed by impressions can still report an effective cost per click. If relevant, start with CPM and impression quality.
One USD 120 cohort comparison: cheaper clicks, weaker paid results
Everything below is hypothetical, not customer results. Two campaigns promote the same product in the same one-week Asia/Taipei click period. Use the same last-click rule with no other ad interactions. Count registrations and first purchases attributable to those clicks within the same seven-day click window, then wait for the last click's full window and complete reporting. Each person registers once and makes at most one purchase; buyers are a subset of registrants. Keep the two action counts separate.
Each buyer pays USD 80. Revenue is net of refunds and discounts, excludes tax and shipping, and has been reconciled; this example has no refunds. All amounts are USD. We have not deducted product, fulfillment or operating costs.
| Metric | Campaign A | Campaign B |
|---|---|---|
| Ad spend | USD 120 | USD 120 |
| Ad clicks | 600 | 1,200 |
| Completed registrations | 12 | 6 |
| New paying customers | 3 | 1 |
| Attributed net revenue | 3 × 80 = USD 240 | 1 × 80 = USD 80 |
| Average CPC | USD 0.20 | USD 0.10 |
| Click-to-registration rate | 2% | 0.5% |
| Registration CPA | USD 10 | USD 20 |
| Ad cost per new paying customer | USD 40 | USD 120 |
| Revenue ROAS | 240 / 120 = 2x | 80 / 120 ≈ 0.67x |
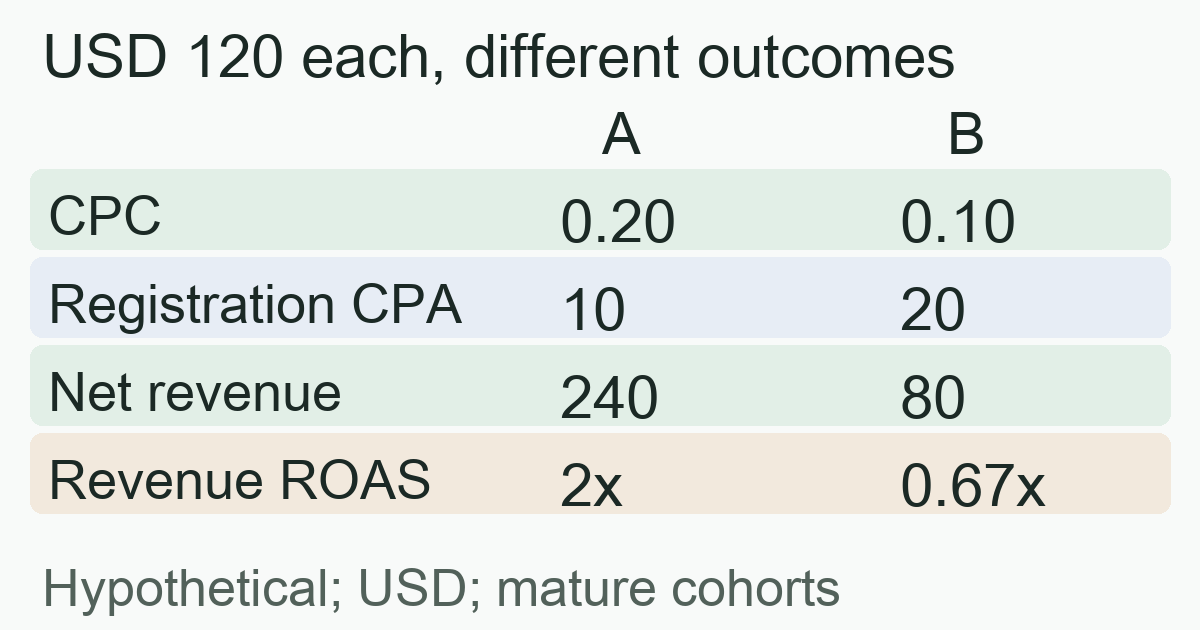
B buys twice as many clicks at half the CPC, yet produces fewer registrations, fewer buyers and less revenue per ad dollar. A looks better for these observed outcomes, but 2x ROAS still does not prove profit. Nor do three buyers versus one establish a stable winner. Check costs, sample uncertainty and whether the result persists before scaling.
For this aligned scope, registration CPA = average CPC / click-to-registration rate. A gives 0.20 / 0.02 = USD 10; B gives 0.10 / 0.005 = USD 20. Enter 2% as 0.02. Revenue ROAS = attributed net revenue per click / average CPC: A gives (240 / 600) / 0.20 = 2x. These are identities for the same mature cohort, not evidence that cheap clicks cause poor results.
Which metric should guide the next decision?
Use CPC to inspect the cost of buying traffic, registration CPA to inspect completed signups, and revenue ROAS to inspect measured payment value. If payments are not connected, ROAS is unavailable; do not turn registrations into assumed revenue or report a measured zero.
At B's USD 0.10 CPC, a USD 10 registration CPA would require a 1% click-to-registration rate. That is a planning threshold, not a promise. Check whether the ad attracts the intended audience, the page matches its promise, a mobile form fails, or completed events are missing. If registrations hold steady while payment falls, investigate the next stage instead of chasing cheaper clicks.
For profit, match those orders with costs as explained in ROAS versus ROI. A high ratio on immature or incomplete data is not a sound budget decision.
Three mistakes that distort a comparison
Averaging averages. Suppose one campaign has 100 clicks at USD 0.10 CPC and another has 10 clicks at USD 1. Total spend is USD 20 across 110 clicks, giving about USD 0.182 CPC. Averaging the two CPCs into USD 0.55 ignores their different volumes. Align currency and cost scope before combining them.
Replacing ad clicks with visits. Reloads can add page views, and one person can click more than once. Keep ad clicks, successful arrivals, and unique visitors in separate columns. If the formula uses ad clicks, do not switch to on-site visits halfway through and multiply by the platform's CPC. A click-to-arrival gap deserves investigation, but the gap alone does not establish fraud.
Changing conversion counting silently. Google Ads documents options to count one or every conversion after an interaction. This is not globally unique customer deduplication across all clicks. Keep registrations separate from repeat purchases, and annotate tracking changes so a new counting rule does not masquerade as better traffic quality.
A practical check before changing budget
- Name the outcome. Specify completed registration, a valid lead, or a first payment. Do not replace completion with a button click.
- Collect aligned raw totals. Record spend, ad clicks, completed events, currency, time zone, attribution, and counting rules. Align the click cohort and maturity; do not combine reports using different date bases without reconciliation.
- Calculate aligned costs and outcomes. Show average CPC, click-to-goal conversion rate, CPA and, when payment value is measured, revenue ROAS. Missing cost or tracking means unavailable data. Zero clicks makes CPC undefined; zero conversions makes CPA undefined. Neither means zero dollars.
- Validate data before delivery changes. Reconcile completed outcomes against destination records and check whether recent events have yet to arrive. Then examine differences in source, creative, device, or page.
- Test one explanation at a time. For example, fix an ad-to-page promise mismatch while keeping the goal and counting rules stable. Observe enough mature outcomes. A small controlled test answers more than chasing the lowest CPC before understanding the cause.
For checking whether acquired traffic continues to registration or first deposit, MeetROAS campaign pages and connected downstream events can help observe that path. Its event documentation defines these completed outcomes separately; the destination still needs to send the actual data. Page views are not the supplier's billable clicks and cannot replace its spend and click report.
Frequently asked questions
Should I increase budget whenever CPC falls?
First examine mature CPA for the same goal, outcome volume, and downstream quality. If conversion rate falls faster than CPC, acquiring the result becomes more expensive. A small sample also does not establish a stable winner.
Can I work backward from target CPA to an acceptable CPC?
As a planning estimate, acceptable average CPC = target CPA × estimated click conversion rate. USD 10 at 2% gives USD 0.20. This is not a recommended maximum bid or a guarantee. Recalculate when conversion rate, traffic mix, or actual costs change.
Sources
- Google Ads: Average cost-per-click (Avg. CPC): Definition — Checked: 2026-10-19
- Google Ads: Average CPA: Definition — Checked: 2026-10-19
- Google Ads: About Target ROAS bidding — Checked: 2026-10-19
- Google Ads: About conversion counting options — Checked: 2026-10-19
- MeetROAS Developer Hub: Partner Event API and event catalog — Checked: 2026-10-19