Marginal ROAS asks what the extra budget buys
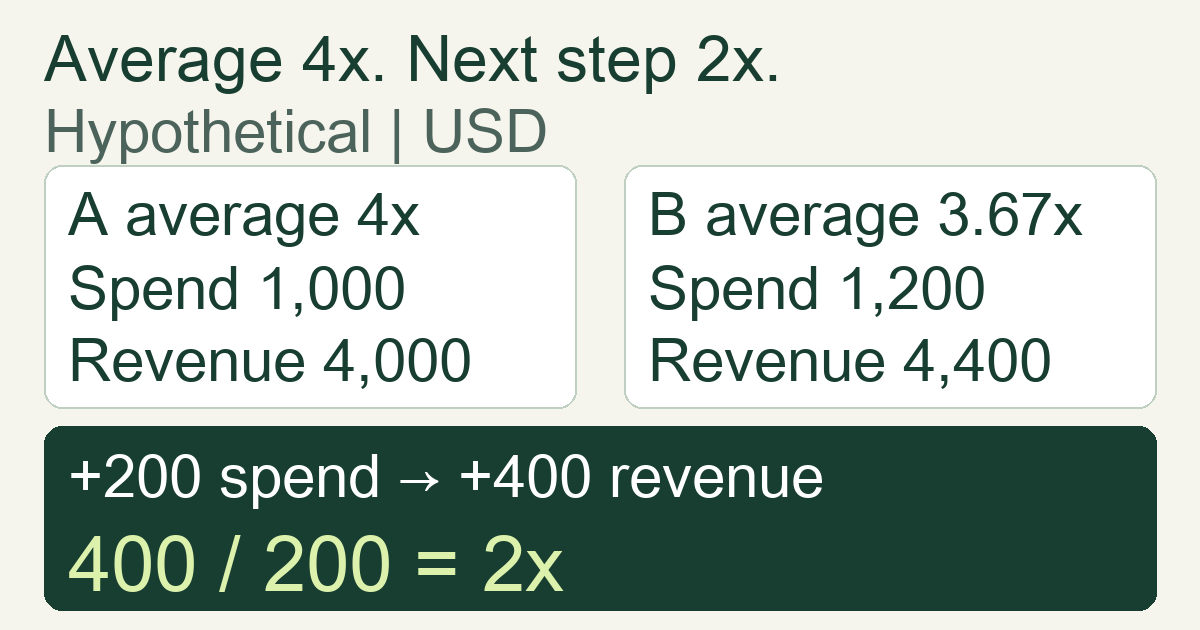
Marginal ROAS is additional conversion value divided by additional ad spend. Average ROAS describes the whole budget; marginal ROAS examines a particular increase. If a hypothetical plan adds USD 200 of spend and USD 400 of revenue, that step returns 2x, even if the campaign's average remains above 3x. A strong average does not guarantee the next increase pays for itself.
Google Ads describes marginal ROAS in terms of the value or revenue from additional spend. For a buyer, the useful question is concrete: “Should I approve this next budget step?” It differs from asking whether the campaign has performed well overall. Start with the ordinary ROAS definition if the revenue-to-spend ratio is unfamiliar.
Formula: compare the same value at two spend levels
For a positive increase in spend:
Marginal ROAS over the step = (value at higher spend − value at lower spend) / (higher spend − lower spend).
Average ROAS at either level is total value / total spend. Both ratios are in multiples: 2x means two dollars of the stated value per dollar of spend. The step formula is a finite comparison, not a claim about every individual additional auction.
Name the numerator first. Revenue, pre-ad contribution, deposits, and estimated lead values are different quantities. This article uses net revenue, after discounts and refunds and excluding taxes collected for authorities. A contribution-value ratio cannot use a revenue-based threshold unchanged. Keep conversion value and revenue separate.
Compare the same campaign scope, currency, reporting timezone, attribution rules, and conversion maturity. If the spend difference is zero, the step ratio is undefined. If cost or value is missing, label it unavailable rather than substitute zero. A negative value difference can produce a negative ratio, but the arithmetic alone does not explain why it happened.
Worked example: a 4x campaign can reject a budget increase
These are invented planning scenarios, not customer results, a platform forecast, or two measured weeks. Imagine the same weekly campaign scope in Asia/Taipei, in USD. Both scenarios assume complete seven-day click windows and reconciled refunds for the corresponding orders. We assign the revenue amounts solely to demonstrate the calculation; they are not predictions.
| Scenario | Ad spend | Net revenue | Average ROAS |
|---|---|---|---|
| A | USD 1,000 | USD 4,000 | 4x |
| B | USD 1,200 | USD 4,400 | About 3.67x |
The step from A to B adds USD 200 spend and USD 400 revenue. Marginal ROAS = 400 / 200 = 2x. Looking only at B's 3.67x average hides the weaker return assigned to the added budget.
Now assume, in both scenarios, every revenue dollar leaves 40 cents after non-ad variable costs. This is a 40% pre-ad contribution margin, before advertising and fixed overhead. It is not final net profit. Shopify's contribution-format explanation separates variable costs from fixed expenses; here advertising is listed separately to avoid deducting it twice.
Under these assumptions, contribution after ads is USD 4,000 × 40% − 1,000 = USD 600 in A, versus USD 4,400 × 40% − 1,200 = USD 560 in B. The added step reduces contribution by USD 40: 400 × 40% − 200 = −40. Fixed overhead is assumed unchanged and excluded from both amounts. Any extra staffing, fees, or product-mix change would require recalculation.
The matching break-even ROAS is 1 / 0.40 = 2.5x. B's overall average exceeds it, while the 2x step does not. That is why “the average is profitable” is insufficient approval for more budget. The numbers do not establish that a real campaign has this response curve.
Estimates, observed differences, and causal lift are different evidence
Before spending more, a simulator may provide alternative cost and value estimates. Google's simulator documentation explains that these are modeled from auction information. Availability and conversion estimates depend on data, and conversion delay affects interpretation. A missing estimate is unknown, not zero return. Clearly label a scenario calculated from estimates; it is not an achieved result.
After a real change, subtracting this week's attributed revenue from last week's gives an observed difference, not proof of revenue caused by the budget. Creative changes, promotions, audience mix, competition, tracking changes, and late conversions can also move the totals. Matching timezone and window removes reporting inconsistencies, not those other causes.
Causal incremental ROAS asks a different question: how much additional outcome advertising caused relative to a credible no-ad or lower-spend comparison. A suitable holdout or other defensible causal design is needed to support that interpretation. A budget-step calculation can use causal estimates when available, but simply naming a spreadsheet column “incremental” does not create that evidence.
A practical check before approving the next step
- Define the decision. Write down the proposed spend increase, campaign scope, evaluation window, and maximum acceptable loss. A higher budget cap is not proof that actual spend will rise by the same amount.
- Align the inputs. Reconcile actual spend, the chosen value, refunds, and attribution settings. Wait for the chosen window to mature; see conversion delay. Keep unavailable inputs visible.
- Compare the extra slice with its economics. Use the costs that change, a matching margin, and a stated profit requirement. Do not apply this example's 2.5x floor to every business.
- Run a limited test and review its limits. Keep other changes controlled where feasible, record unavoidable differences, and evaluate mature results. A simple before/after test remains descriptive; it does not establish causal lift or guarantee the following step.
MeetROAS can help organize Campaign costs and connected downstream events for that reconciliation. Its event documentation distinguishes the outcomes a destination reports. The current deposit-based ratio is not automatically net revenue or profit, and cost coverage still matters. A budget-response forecast and contribution calculation require separate evidence; do not read either into a tracking report.
Common questions
Is a marginal ROAS below the average always bad?
No. A weaker step can still add useful contribution if its matched return clears the relevant costs and profit requirement. In the hypothetical example, 2x fails the stated 2.5x floor. A different margin could change that conclusion.
Should I move budget to the campaign with the highest average?
Not from that fact alone. Its next available traffic may differ from its historical traffic. Compare the next feasible steps with aligned evidence and uncertainty, rather than extrapolate either campaign's average indefinitely.
Sources
- Google Ads: Optimize for marginal ROI instead of average ROI — Checked: 2026-10-27
- Google Ads: Estimate your results with bid, budget, and target simulators — Checked: 2026-10-27
- Shopify: Contribution Format Income Statement — Checked: 2026-10-27
- MeetROAS: Partner Event API reference — Checked: 2026-10-27