Different ROAS reports: check the orders before changing budget
Different ROAS figures can reflect different sets of orders or genuinely missing data. Align spend, order scope, and dates, then explain the difference record by record. An ad platform assigns credit under its rules. A tracker reports the attributable events it has received. A store records business transactions. Applying the same date filter does not make these identical reports.
If a platform shows 4x, a tracker shows 3x, and store receipts divided by ad spend give 6x, neither choosing the highest nor blaming the lowest is justified. Confirm that you mean revenue ROAS rather than another conversion value, then reconcile the records.
A worked bridge from 6,000 to 3,800
All figures are hypothetical teaching examples, not customer results. Select ad clicks acquired September 1–7, 2026, costing a complete USD 1,000, using Asia/Taipei throughout. The comparison uses a seven-day click window and the last eligible click, with no view-through credit, modeled conversions, or assigned lead values. Export on September 21: the final click day's window ended September 14, and refunds are checked through September 20. These are the example's common comparison rules, not universal product defaults.
Eight eligible paid orders each contain USD 500 of discounted merchandise, totaling 4,000, excluding tax and shipping. A subsequent USD 200 refund against one of those orders leaves 3,800 on the chosen after-refund basis. Four other USD 500 orders were also paid September 1–14, but verification shows they do not belong to these eligible clicks—for example, organic traffic or earlier clicks.
The platform records all eight payments but has not reflected the refund: 4,000. The tracker received only six: 3,000. The store export filters September 1–14 payment dates and includes all twelve: 6,000; that exported column also precedes refunds.
| Step (USD) | Platform | Tracker | Store |
|---|---|---|---|
| Original | 4,000 | 3,000 | 6,000 |
| Outside orders | 0 | 0 | −2,000 |
| Missing reports | 0 | +1,000 | 0 |
| Same-cohort paid | 4,000 | 4,000 | 4,000 |
| Verified refund | −200 | −200 | −200 |
| After refunds | 3,800 | 3,800 | 3,800 |
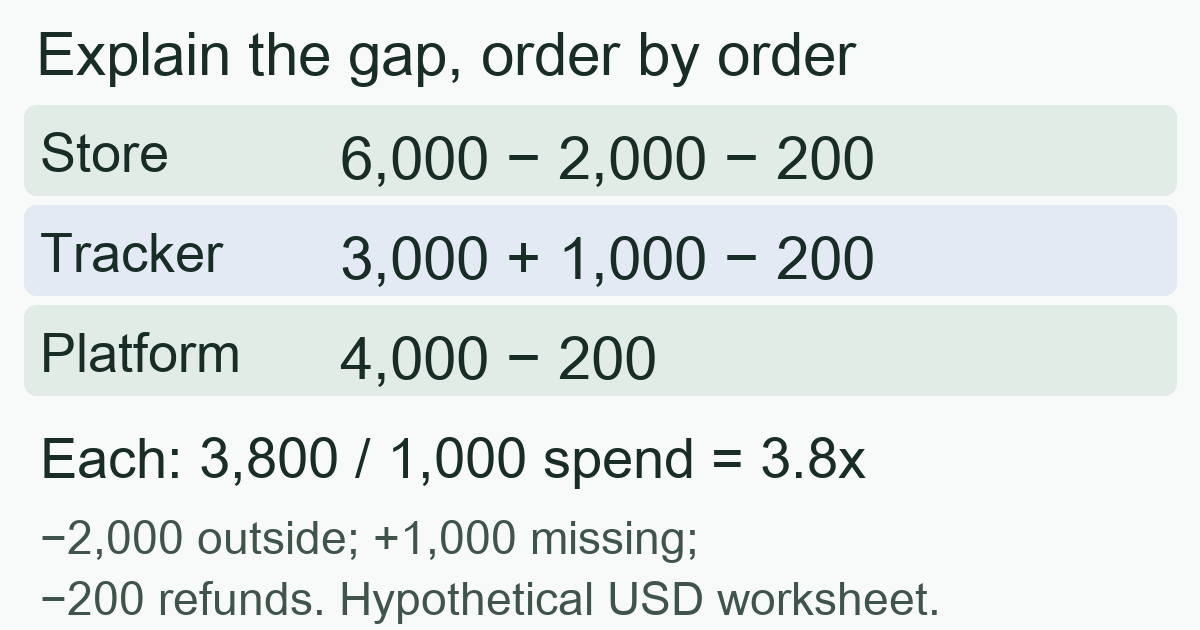
6,000 − 2,000 − 200 = 3,800; 3,000 + 1,000 − 200 = 3,800; 4,000 − 200 = 3,800. After-refund cohort ROAS is 3,800 / 1,000 = 3.8x. Every adjustment corresponds to identified orders; no residual is erased as generic “tracking error.”
This is a manual worksheet, not confirmation that three systems were changed. Repair the tracker's missing reports and verify their actual acceptance. Apply supported platform refund corrections and read back their effect. Unverified orders cannot simply be added as revenue. The 3.8x figure excludes product and operating costs and does not prove ads caused all the sales.
Align the date basis and the conversion action
Google Ads' conversion reporting documentation explains that primary conversion columns assign results to the ad interaction date; conversion-time columns are also available. A September 7 click followed by a September 10 payment belongs to September 7 in a click-date report and September 10 in a payment-date report. It remains one order.
To compare daily payments, use the appropriate conversion-time column and filter the same purchase action. To evaluate a batch of ad spend, connect subsequent eligible payments back to that click cohort. Do not divide all payments from September 1–7 by that week's spend without checking membership. Nor should you mix registrations, purchases, and view-through outcomes just to make totals agree.
Then check time zone, currency, tax and refund treatment, campaign scope, attribution model, and attribution window. Google Ads' Conversions and All conversions can cover different actions. Modeled or cross-device results may not have an order-level list available for matching. Preserve those differences rather than pretending every total can be reconciled one to one.
Shopify's analytics-discrepancy guidance also identifies differences in tracking mechanisms, privacy settings, blockers, and reporting time zones. An unobserved browser event does not establish that no sale happened. An order in the store does not establish that a particular ad deserves credit either.
Turn each difference into a verifiable action
Start with one campaign, one payment action, and a mature period rather than all historical data. Keep a controlled internal worksheet with an anonymous order reference, payment and refund times, original currency and amounts, matched traffic cohort, receipt status in each system, discrepancy reason, owner, and check time. Do not publish personal data or real click identifiers.
| Finding | Next verifiable action |
|---|---|
| Store payment missing from tracker | Check eligibility, identifier persistence, event dispatch, and acceptance; do not substitute zero revenue |
| An order appears twice | Distinguish two real payments from a retry of one fact; deduplicate using the system's order/event identity without deleting valid repeat purchases |
| Orders match, amounts differ | Check discounts, tax, shipping, currency, fixed values, and reflected refunds |
| Recent dates keep accumulating results | Separate payment delay from processing delay; compare again at a fixed check time |
| Modeled or differently allocated credit | Keep an explicitly non-matching portion; do not invent orders to fill it |
Google's conversion-lag guidance explains why the wait from click to conversion can make recent CPA look higher and ROAS lower. Even a completed seven-day window does not rule out later refunds or processing delays. Preserve the export time and the “as of” cutoff.
MeetROAS can relate connected destination events to campaigns, helping locate the stage where a discrepancy appears. Its current event documentation defines amounts as destination supplied and distinguishes registration from effective deposits. Deposits are not automatically merchandise revenue; event acceptance does not establish that the upstream platform counted it. Compare destination records, delivery status, and the platform's actual report. This is not a claim of automatic financial reconciliation.
When is the result usable for budget decisions?
Explain spend completeness, the selected event and value basis, the maturity cutoff, and any unexplained amount. Keep unresolved differences visible. There is no universal “20% difference is normal” allowance: two missing high-value orders could reverse the source ranking.
If the example still lacks attribution evidence for two orders, record “1,000 awaiting verification” instead of declaring the tracker corrected to 3.8x. After missing reports and refund corrections have readback evidence, compare consistent results. Only then move to allocating budget across traffic sources.
Frequently asked questions
Is the order system the only correct answer?
It can verify business records such as payments and refunds. How much credit an ad receives still requires attribution rules. Accounting revenue, cash receipts, and attributed conversion value can also differ; reconcile each for its intended purpose.
Can I add revenue from every ad platform?
Not directly. Several platforms can claim the same order. Establish a consistent cross-source rule and remove overlapping credit. Platform-specific optimization figures may remain useful individually; they do not mean the company collected additional payments.
Sources
- Google Ads: Understand your conversion tracking data — Checked: 2026-10-21
- Shopify: Analytics discrepancies — Checked: 2026-10-21
- Google Ads: About conversion lag reporting — Checked: 2026-10-21
- MeetROAS: Partner Event API — Checked: 2026-10-21