Decide what the next budget should achieve
Comparing traffic sources means choosing where to test the next budget, rather than assigning platforms a permanent rank. Align the goal, cost scope and observation period, then inspect completed outcomes, payment quality and contribution after advertising. Cheaper registrations or a higher ROAS alone cannot identify the next budget winner.
A media buyer may find that source A produces many inexpensive registrations, while fewer registrants from B are more likely to pay. If the objective is new paying customers, registration CPA is incomplete. If cash generation matters, payment value, fulfillment costs and payback time matter too.
Start with CPA's event denominator and the direct CPC, CPA and ROAS comparison if the units are unfamiliar. This article takes the next step: reading one source-comparison worksheet and checking whether a budget increase remains worthwhile.
Make the comparison consistent first
Google Ads defines average CPA using cost divided by completed conversions. Its Target ROAS documentation uses conversion value relative to advertising spend. Comparing registrations with purchases, or estimated values with net revenue, does not become meaningful by adding decimal places.
- One goal definition. Separate completed registrations, unique new paying customers and orders. An event retry must not create another customer.
- Comparable conditions. Align country, device, products and promotions. Separate prospecting from retargeting, which can represent different purchase intent.
- Complete costs. Use one currency and reconciled actual advertising spend. Treat credits, taxes and agency fees consistently.
- One attribution convention. Fix the timezone, click-cohort date basis, model and window. Do not simply add orders that different platforms each claim.
- Equal maturity. Wait for the cohort's conversions and value reporting to complete. State the cutoff for outcomes that can still change after refunds.
Google's conversion-lag guidance explains why unreported conversions can make recent CPA appear higher and ROAS lower. Use the attribution-window example to distinguish eligibility from the report date range. Missing data is not zero performance: without reliable payment reporting, keep that result unavailable.
Two sources spend USD 600 each: which should get more?
Everything below is hypothetical teaching data, not customer results. Two source-specific campaigns sell the same product range, but customers choose different baskets. Geography, devices and promotions match; both target new prospects. Use September 1–7, 2026 click cohorts in Asia/Taipei, one shared 14-day last-click rule, no view-through credit, and assign each order to only one source. Reconciliation completes on September 25.
Each new customer registers and purchases at most once; buyers are a subset of registrants. Net revenue deducts discounts and refunds and excludes tax and shipping charges. Variable costs include products, fulfillment and payment fees. All amounts are USD. This aligned descriptive comparison is not a randomized experiment.
| Item | Source A | Source B |
|---|---|---|
| Actual advertising spend | 600 | 600 |
| Completed registrations | 60 | 30 |
| Unique new paying customers | 12 | 15 |
| Attributed net revenue | 1,800 | 1,500 |
| Related variable costs | 900 | 600 |
| Registration CPA | 600 / 60 = 10 | 600 / 30 = 20 |
| Ad cost per new paying customer | 600 / 12 = 50 | 600 / 15 = 40 |
| Revenue ROAS | 3x | 2.5x |
| Contribution after variable and ad costs | 300 | 300 |
A has cheaper registrations and a higher revenue ROAS. B acquires new paying customers at lower advertising cost. Yet both leave USD 300 after variable and ad costs: net revenue minus variable costs minus advertising. Different baskets mean each payment need not leave the same amount. Fixed salaries, software and income tax are excluded, so USD 300 is not company net profit. See ROAS versus ROI cost scope.
If the priority is more new paying customers, B merits further testing. A may still serve a revenue-volume objective. Neither result establishes efficiency at a higher budget. With only 12 and 15 buyers, a few orders can influence the result; inspect unusually large payments and refund distribution first.
Test the next budget, not the historical average
Continue the hypothetical case with an equally long September 8–14 click cohort. This cohort contains different new customers, with no orders repeated from the preceding cohort. Actual ad spend for each source rises from USD 600 to USD 800, with the same window and reconciliation completed on October 2. A now reports USD 2,100 net revenue and USD 1,080 variable costs; B reports USD 2,000 and USD 800.
| Change from the preceding period | Source A | Source B |
|---|---|---|
| Advertising spend change | +200 | +200 |
| Attributed net revenue change | +300 | +500 |
| Variable cost change | +180 | +200 |
| Contribution change after advertising | 300 − 180 − 200 = −80 | 500 − 200 − 200 = +100 |
A's contribution after advertising falls from USD 300 to USD 220; B's rises from USD 300 to USD 400. A remains positive overall, but that does not make the larger budget more attractive. Historical 3x ROAS does not guarantee USD 600 revenue from the next USD 200.
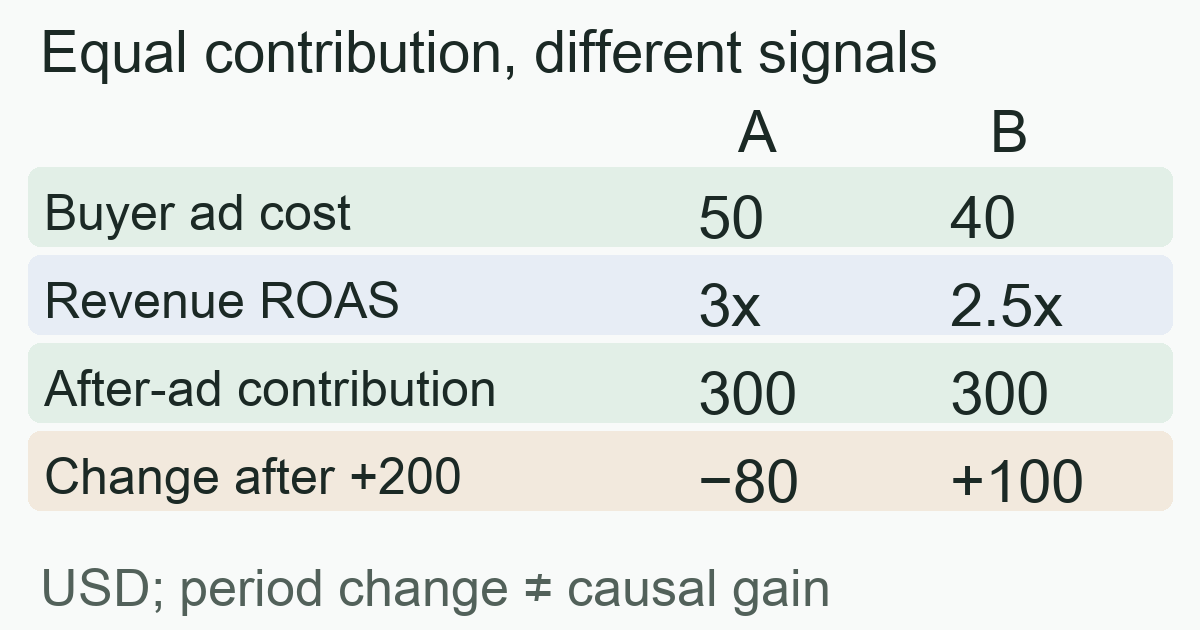
These are differences between periods, not proven causal increments. Seasonality, auctions, audience overlap and organic orders can alter the result. The comparison cannot establish that increasing budget caused B to earn another USD 100. Google Ads experiments can split budget or traffic to compare settings in supported situations; comparing different platforms does not automatically create one randomized experiment.
Write a practical budget-test brief
- Set one primary objective and guardrails. For example, choose a paying-customer ad-cost ceiling from your margin and payback requirements, while monitoring refunds and cash recovery.
- Preserve acceptable existing delivery and define a test amount you can afford to lose. USD 200 above is an illustration, not a universal increase percentage. If the baseline loses money, investigate before automatically adding budget.
- Change one main factor. Record source, audience, creative, page and dates; hold other conditions as stable as possible and identify differences you cannot control. Consider a suitable randomized experiment when available.
- Set a spend cap, maturity date and safety stop before launch. One good early order does not establish a winner; a short period without payments does not establish permanent worthlessness.
- Once mature, check paying-customer cost, net revenue, variable costs and contribution together. If the result is unclear, retain a small test or stop expanding. You do not have to declare a winner.
MeetROAS source-specific campaigns, landing pages and connected destination events can help examine the path to completed registration and first deposit. Its event documentation keeps those business facts separate. Visibility depends on the data actually connected: a first deposit is not merchant net revenue, and missing payments or product costs still need destination and accounting reconciliation.
Frequently asked questions
Is there a fixed best budget split?
No split fits every product. Start with the objective, sustainable cost, payback period, sample and affordable loss, then distinguish maintaining delivery from exploration. A platform name is not evidence.
Can I add different sources' ROAS figures?
No. Ratios cannot be added, and two platforms may claim the same order. Establish consistent, deduplicated revenue and spend sets, then divide total revenue by total advertising spend. That still does not prove advertising's incremental effect.
Should I immediately stop a source with no paying customers?
Distinguish missing tracking, immature data and reliably observed zero payments. After those checks, reaching the predeclared spend or risk limit can justify stopping the test. You need not wait indefinitely for a statistical conclusion that may never arrive.
Sources
- Google Ads: Average CPA — Checked: 2026-10-20
- Google Ads: About Target ROAS bidding — Checked: 2026-10-20
- Google Ads: About conversion lag reporting — Checked: 2026-10-20
- Google Ads: About the Experiments page — Checked: 2026-10-20
- MeetROAS: Partner Event API and event catalog — Checked: 2026-10-20