An A/B test compares page choices, not two different audiences
Landing-page A/B testing randomly assigns eligible visitors to alternatives during the same period, then compares a predefined outcome. A control is the current page; a variation is the proposed change. The useful question is specific: does explaining the offer more clearly lead to more completed registrations, without reducing lead quality?
Sending Google traffic to A and social traffic to B answers a different question: those audiences and pages differ together. Running A this week and B next week also mixes the change with timing. Neither comparison alone isolates the page's effect. First check the campaign funnel: a broken form needs repair before an experiment on its headline.
Write a hypothesis that tells you what to change
Imagine a fictional online course advertises a free introductory lesson. The existing headline, A, says “Start learning today.” B says “Try the introductory lesson free.” The hypothesis is that making the same offer explicit will increase valid completed registrations. Keep the price, eligibility, image, form and destination unchanged. Both headlines must describe the real offer.
This is an illustrative test design, not customer evidence or a claim that one phrase always converts better. Microsoft's planning guidance connects a clear hypothesis to measurable success and a suitable assignment unit. Define one primary outcome before launch; button clicks can help explain behavior but cannot stand in for completed registrations.
For a first test, one bounded change makes the result easier to interpret. If you change the headline, price and form together, you can assess that package; you cannot attribute its result to the headline alone. Message match helps decide whether the proposed wording actually preserves the ad's promise.
Allocate concurrently and keep the assignment stable
For this example, choose an eligible browser identifier as the assignment unit. Allocate it randomly to A or B when it first enters the test, before either alternative is shown. Record that assignment and reuse it on eligible repeat visits. Count the identifier once in the denominator, rather than counting every refresh as a new person.
A browser identifier is not a person: cleared cookies, different devices or separate browser contexts can break continuity. State the actual identification boundary. A signed link or cookie does not prove that all visits belong to one unique human.
Keep eligibility, traffic settings and observation dates consistent. An intended 50/50 allocation does not require precisely equal observed counts in every small sample. If one group has unexpected missing records, investigate assignment, redirects, event collection and exclusions before interpreting lift. Microsoft's sample-ratio research explains why a formal mismatch check needs sample size, not just a glance at the percentages.
Read 8% versus 10% without inventing a winner
All numbers below are hypothetical teaching values. Suppose each group has 1,000 eligible assigned browser identifiers. For each identifier, count at most one valid completed registration during seven days after assignment. Assume the system can link and deduplicate those outcomes reliably, with test accounts excluded by a rule fixed before allocation.
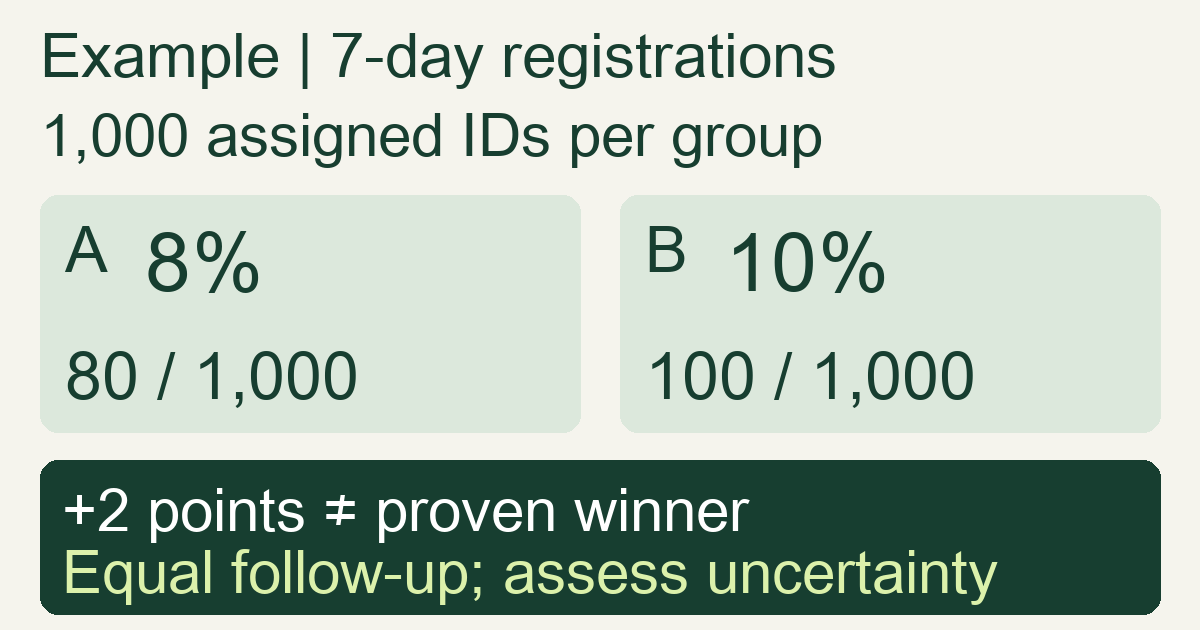
| Same counting rules | A: current headline | B: explicit free lesson |
|---|---|---|
| Eligible assigned identifiers | 1,000 | 1,000 |
| Identifiers with a valid registration | 80 | 100 |
| Registration rate | 80 / 1,000 = 8% | 100 / 1,000 = 10% |
| Observed difference | Reference | +2 percentage points; +25% relative |
The relative difference is (10% − 8%) / 8% = 25%. It is not 25 percentage points, and it is not a demonstrated 25% profit increase. See the conversion-rate denominator before comparing a dashboard based on visits or repeat events with this identifier-based example.
Use all eligible assigned identifiers in this example's denominator. Counting only those who successfully loaded the changed page can hide people lost because that page failed. An identifier with complete follow-up and no valid registration contributes zero successes; an outcome pipeline with missing records is a measurement problem, not evidence of zero conversions.
Seven days and 1,000 identifiers are assumptions for arithmetic, not universal test requirements. Give the last recruited identifier the same full follow-up before final analysis. A calendar-week total usually gives late entrants less time; the conversion-delay lesson explains that trap. The observed rates alone do not establish statistical reliability or justify declaring B the winner.
Decide the stopping rule before the numbers look attractive
Write down the primary outcome, eligible population, allocation unit, follow-up length, analysis method and stopping rule before launch. With an ordinary fixed-sample analysis, repeatedly checking for significance and stopping at the first favorable result increases false-positive risk. A method designed for sequential monitoring has different rules; a daily dashboard does not automatically provide one. Optimizely's comparison of statistical methods distinguishes these approaches.
There is no responsible universal answer such as “run seven days” or “100 conversions are enough.” A meaningful improvement, baseline rate, uncertainty and available traffic affect planning. This article explains the comparison workflow; it does not supply a sample-size calculator. Safety checks still continue during a test: investigate broken pages or tracking promptly rather than waiting for the planned decision date.
A practical launch and readout checklist
- Before launch: record the hypothesis and exact A/B versions. Test both routes on mobile, including loading behavior, error recovery and the completed outcome. Keep a change log.
- While running: inspect allocation and event completeness. Avoid silently changing targeting, offers or exclusions. If a material repair is necessary, document the interruption and reassess whether the same test remains interpretable.
- At readout: wait for comparable follow-up, check the planned uncertainty assessment and examine downstream quality. More registrations with fewer qualified customers may fail the business objective.
- Choose the next action: adopt a supported improvement, retain the control when the variation harms the goal, or record an inconclusive result and redesign. Insufficient evidence is a valid result.
MeetROAS supports Campaign A/B alternatives and connected downstream outcomes; its event reference distinguishes completed registration from deposit events. Use that connection to examine what happened after a page choice. Check the report's counting basis: repeat event totals are not automatically unique-person conversion rates, and attribution alone does not establish statistical significance or profit.
Sources
- Microsoft Research: Patterns of Trustworthy Experimentation — Pre-Experiment Stage — Checked: 2026-10-30
- Microsoft Research: Diagnosing Sample Ratio Mismatch in A/B Testing — Checked: 2026-10-30
- Optimizely: Fixed horizon, Bayesian, or sequential — choosing a stats engine — Checked: 2026-10-30
- MeetROAS: Partner Event API reference — Checked: 2026-10-30