Landing-page speed needs a page, an audience, and a measurement
Measure landing-page speed by fixing the actual ad destination, device group, and measurement method, then checking when the main content appears and whether the next step works. A PageSpeed Insights lab score, real-user LCP, and registration rate answer different questions. LCP means Largest Contentful Paint: the rendering time of the largest eligible image, text block, or other qualifying content in the viewport.
Imagine a buyer sees a score of 98 in one test but waits for the main image after tapping an ad on a phone. The report is not necessarily broken. Device conditions, redirects, and the route may differ. Likewise, a weak conversion rate does not identify slow loading as its cause.
Use lab data to investigate and field data to understand visitors
Google's PageSpeed Insights documentation distinguishes a controlled simulated load from eligible Chrome users' real experiences. Lab results help reproduce a problem. Field results reflect varied devices and networks. Different numbers do not automatically make either result wrong.
Read four labels before comparing: mobile or desktop; one URL or the whole origin; lab or field; and collection dates. An origin is normally defined by scheme, host, and port. Its aggregate is not a measurement exclusively of one campaign page.
PSI field data covers the preceding 28 days. With insufficient page data, it can fall back to the origin; with insufficient origin data, no field result is available. That is neither zero seconds nor a pass. The CrUX methodology requires public discoverability and sufficient samples. Absence alone cannot diagnose low traffic or an indexing failure.
LCP, first content, and load completion are different milestones
All times here are fictional teaching values, not MeetROAS or customer measurements. Assume one controlled lab load: First Contentful Paint, or FCP, at 0.9 seconds, a main image becoming the LCP candidate at 2.8 seconds, and the load event at 4.0 seconds. This order describes the example, not a required sequence on every page.
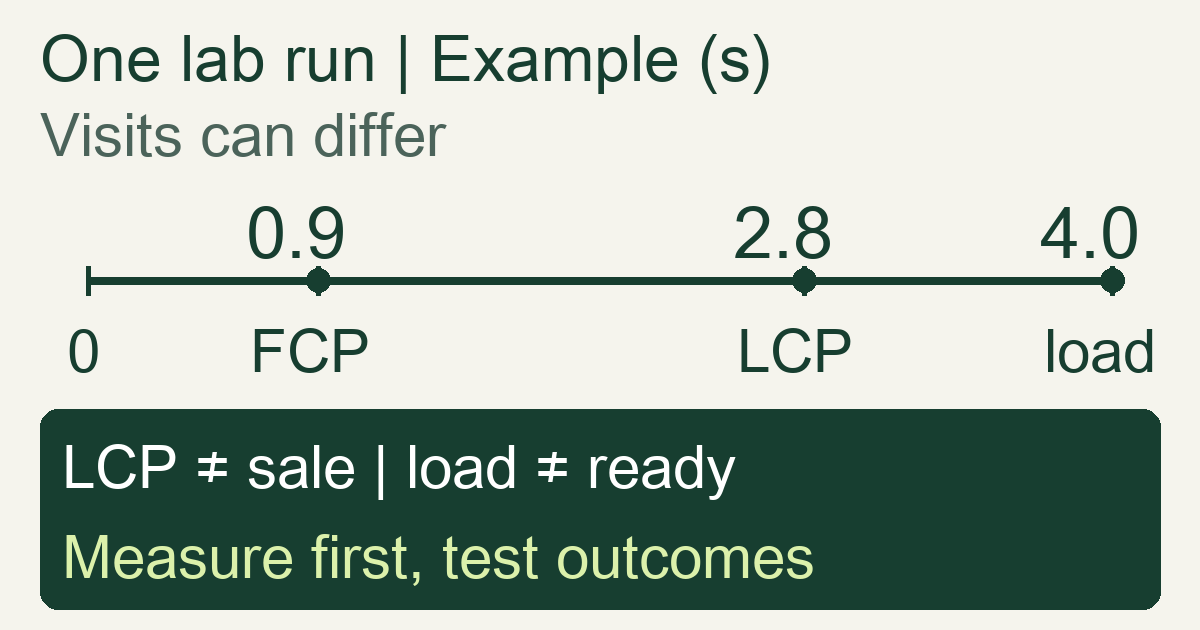
FCP means some content has appeared, possibly just text; LCP concerns larger main content. The LCP definition explains that field measurements can include connection, redirect, and server waiting time. The image download alone is therefore an incomplete explanation.
MDN describes load as an event after the page and dependent resources have loaded, excluding lazily loaded resources. It does not guarantee that a form, installation prompt, or payment journey works correctly. Walk the real mobile route to completion. Main content appearing, a button responding, and a completed registration deserve separate checks.
Understand p75 with numbers, rather than an average alone
The official LCP guidance recommends evaluating the 75th percentile, or p75, separately for mobile and desktop, with a good target of 2.5 seconds or less. Good LCP alone does not establish an overall Core Web Vitals pass; responsiveness and visual stability are other dimensions.
Consider ten hypothetical mobile visits to the same page version in one observation period. Their sorted LCP values are 1.0, 1.1, 1.3, 1.5, 1.8, 2.0, 2.3, 2.8, 3.6, and 4.2 seconds. For teaching only, use the nearest-rank rule: ten times 75% is 7.5; round up to the eighth value, or 2.8 seconds. The mean is 21.6 / 10 = 2.16 seconds.
| Teaching summary | Seconds |
|---|---|
| Mean | 2.16 |
| p75 using this rule | 2.8 |
| Slowest visit | 4.2 |
The lower average hides some longer waits. These ten visits illustrate arithmetic, not CrUX's implementation, an adequate production sample, or proof of passing. Do not mix faster desktop visits into a mobile group and dilute the problem you intended to investigate.
A measurement sequence a media buyer can follow
- Preserve the actual route. Record the ad destination, necessary redirects, final page, and version. Use the designated testing workflow so internal checks do not become paid-performance evidence. Remove private identifiers before sharing a test URL.
- Separate audiences first. Keep mobile and desktop apart; record geography, network, and first versus repeat visits where available. Different groups or periods cannot establish an improvement by themselves.
- Repeat fixed conditions. Run several tests with the same tool, device, and network settings, retaining every value and timestamp. For example, preselect five runs and record their median and range. This is your investigation rule, not a Google passing threshold.
- Give developers observations. Preserve when the main content appeared, failed resources, and relevant screenshots. Ask them to distinguish redirects, server waits, images, and frontend work. A total score cannot identify the root cause.
- Complete the next step. Check buttons, forms, and error recovery, using the funnel to locate a real stop. Also check ad-to-page message match, so an offer mismatch is not blamed entirely on speed.
Without field data, start with controlled tests and real-device investigation, then plan appropriate real-user measurement. Do not invent visitor percentiles. After a release, a rolling 28-day result still contains older visits; record the version date and keep the comparison scope explicit.
Faster loading still needs a business-outcome test
Here is a planning example, not measured uplift. A and B have the same content and offer; B compresses the main image. Each receives 1,000 distinct eligible arrivals, with one valid registration at most per person, equal seven-day follow-up, and test accounts excluded. Assume A records 80 valid registrations and B records 90: rates are 8% and 9%.
That extra percentage point does not prove image compression caused an increase. Before testing, specify the primary outcome, valid allocation, sample and stopping rules, and control other material changes. Without reliable random assignment, disclose audience and timing differences. Use the landing-page A/B testing walkthrough to plan allocation and read the outcome comparison. Check downstream outcomes and costs too. A form click cannot be renamed a registration or profit.
MeetROAS can help compare Campaign pages with connected downstream results; its event reference distinguishes completed registrations and effective deposits. Those outcomes can accompany separate speed measurements. They do not replace PSI or real-user monitoring, or imply a built-in equivalent LCP or CrUX report.
Speed matters to experience, but it guarantees neither conversion lift nor a search position. Google's page-experience guidance also warns that good tool results do not guarantee top rankings. Measure the actual problem, then use mature business outcomes to choose the next step.
Sources
- web.dev: Largest Contentful Paint — Checked: 2026-10-29
- Google: About PageSpeed Insights — Checked: 2026-10-29
- Chrome: CrUX methodology — Checked: 2026-10-29
- MDN: Window load event — Checked: 2026-10-29
- Google: Understanding page experience — Checked: 2026-10-29
- MeetROAS: Partner Event API reference — Checked: 2026-10-29