MER covers the business; ROAS covers selected advertising credit
MER compares whole-business revenue with defined marketing spending. ROAS compares value attributed to selected advertising with its ad spend. A media buyer uses ROAS to investigate which source, creative, or page deserves another test. Someone managing the overall budget uses MER to examine marketing spending relative to business scale. Neither directly measures profit or establishes how many sales would disappear without advertising.
Check the formula before the name: tools can use opposite MER conventions. This article defines MER = total net revenue / explicitly scoped marketing cost, expressed as a multiple. If a report shows a percentage, first check whether it divides spending by revenue. Our revenue ROAS uses attributed net revenue / ad spend. An assigned conversion value should not be relabeled as collected revenue.
One month's ledger: 5x MER and 4x ROAS
All figures are hypothetical, not customer results. Consider September 2026 in Asia/Taipei, with one store and one paid campaign; reporting and refunds are reconciled October 15. Net revenue covers September paid orders, deducts their discounts and refunds through that check date, and excludes collected tax and shipping. This restated order basis is not a cash-flow or accounting-recognition report. The example uses seven-day last-click attribution without view-through credit, and assumes no cross-month attributed orders: all attributed amounts belong to payments in this month.
| Item | USD | Scope |
|---|---|---|
| Total net revenue | 10,000 | All store channels |
| Attributed net revenue | 6,000 | Campaign credit under these rules |
| Ad spend | 1,500 | All paid media in this example |
| Other marketing cost | 500 | Creative, agency, and tools combined |
| Total marketing cost | 2,000 | 1,500 + 500 |
There are no other marketing expenses in the example. Product, fulfillment, and non-marketing operating costs are separate. Therefore:
- Business MER = 10,000 / 2,000 = 5x. Each dollar of included marketing spending corresponds to five dollars of total net revenue.
- Campaign ROAS = 6,000 / 1,500 = 4x. Each ad dollar corresponds to four dollars of net revenue attributed under the stated rules.
- Total net revenue divided only by media cost is 10,000 / 1,500 ≈ 6.67x. That is another, media-only basis; comparing it with 5x does not establish improvement.
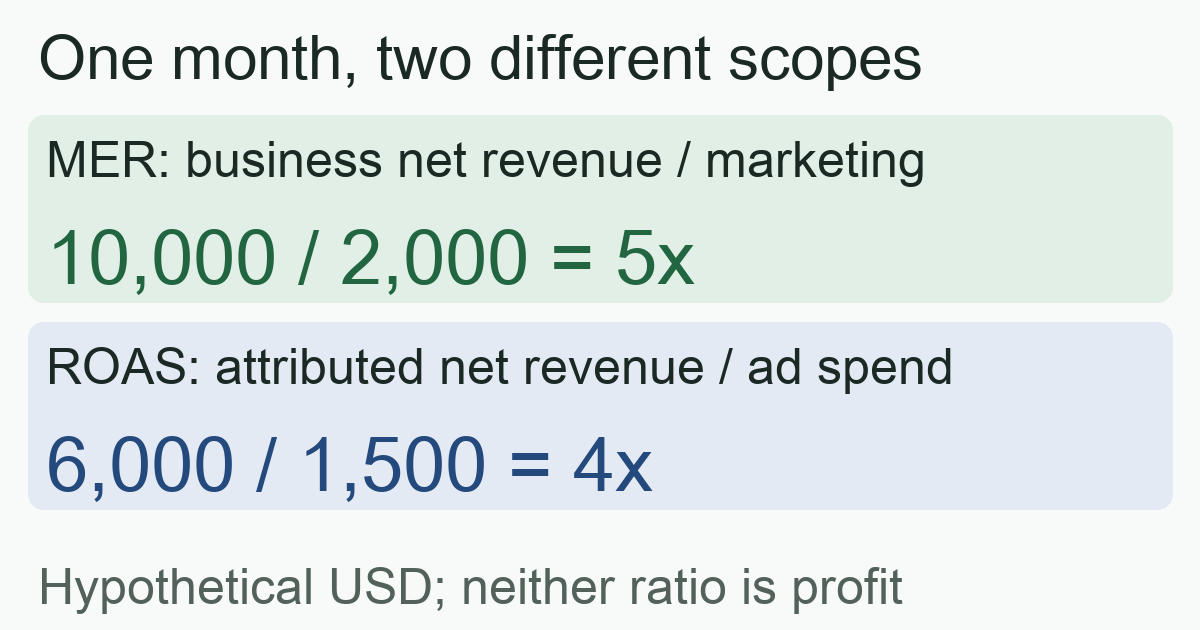
The 6,000 is already inside the 10,000. Adding them into 16,000 double counts. The remaining 4,000 is simply not credited to this campaign under these rules and can include organic sales or repeat purchases. Returning customers with eligible ad interactions can also belong to the attributed 6,000. New versus returning customer and attributed versus unattributed are different classifications.
Real reports often contain cross-month payments and conversion delays. The example's simplifying assumption is not a general rule. Reconcile dates and order scope before interpreting the ratios.
Why does another MER report show 20% instead of 5x?
Shopify's MER guide divides total revenue by total marketing spending. Triple Whale's guide defines its MER as blended ad spend divided by order revenue, displayed as a percentage, and calls the inverse Blended ROAS. Its default order-revenue basis also precedes refunds. A shared metric name does not establish comparable calculations.
Only with identical amounts and scope are 10,000 / 2,000 = 5x and 2,000 / 10,000 = 20% reciprocals. A rising multiple means more revenue per spending dollar; a falling expense percentage means spending consumes less revenue. This is same-data arithmetic, not a claim that Triple Whale's native report would show 20%.
Using media spend of 1,500 instead gives a 15% spending share, not 20%. Switching again to pre-refund order revenue changes the basis further. Name the team's report explicitly—for example, “MER: net revenue / marketing cost including creative, agency, and tools”—and retain the period, currency, and refund cutoff. Missing expense data should remain unavailable, not become zero.
Google Ads' Target ROAS documentation uses reported conversion values relative to cost. Calculating MER elsewhere does not automatically make that advertising ratio cover all company sales or marketing costs.
Does better MER mean the ads became more effective?
Consider another hypothetical month: ad spend remains 1,500, other marketing costs remain 500, and campaign-attributed net revenue remains 6,000. Revenue not credited to that campaign rises from 4,000 to 6,500. Use the same definitions and mature reconciliation process:
| Item | Original month | Later month |
|---|---|---|
| Total net revenue, USD | 10,000 | 12,500 |
| Marketing cost, USD | 2,000 | 2,000 |
| Business MER | 5x | 6.25x |
| Campaign ROAS | 4x | 4x |
MER improves while this campaign ROAS stays unchanged. Overall revenue growth may be welcome, but investigate which customers and activities account for it, and their margins and refunds. The extra 2,500 cannot simply be assigned to this campaign. “Unattributed” does not prove advertising had no influence either.
Conversely, cutting spending can raise the multiple while revenue falls. Evaluate absolute contribution, cash, and growth objectives. Short-term MER can reflect repeat purchases, promotions, seasonality, and earlier investment. A business average cannot guarantee the return from the next budget increase.
A shared checklist for media buyers and business owners
- Fix the formula. Record multiple versus spending percentage and total marketing versus media-only cost. Align conventions before interpreting an apparent reversal.
- Reconcile the business scope. Match stores, channels, period, currency, refunds, and cost categories. All-store revenue over one store's ad spend is misleading.
- Keep campaign analysis separate. Align event, value, attribution model, and maturity. Several platforms may claim the same order, so do not simply add their reported revenue.
- Break down the revenue mix. Examine new and repeat customers, product mix, and channels. This is diagnostic segmentation; MER cannot reverse-engineer each order's source.
- Add profit and a bounded test. Use ROAS versus ROI's cost scope to examine what remains after product, fulfillment, and operating costs. Set an affordable test budget. Period differences are not randomized experiments; estimating additional outcomes caused by ads requires an appropriate incrementality test.
MeetROAS can connect integrated destination events to campaigns, helping inspect registration and first-deposit outcomes. Its event documentation distinguishes business events and monetary meanings. Visibility depends on the actual integration; a deposit is not automatically store net revenue. Business MER still needs revenue across channels and complete marketing expenses. Campaign events alone should not be presented as a measurement of company-wide efficiency.
Frequently asked questions
What is a good MER?
First establish multiple versus percentage, included expenses, margins, fixed costs, and growth objectives. The revenue basis and cost assumptions behind break-even ROAS cannot simply become a universal business MER threshold. The 5x here is arithmetic, not a recommended benchmark.
Can MER replace the ROAS report?
Not by itself. MER relates overall spending to business revenue but cannot identify the specific creative or source to adjust. ROAS describes selected advertising credit but omits the full business cost picture. Choose the report after defining the decision.
Sources
- Shopify: Marketing Efficiency Ratio: How To Calculate + Improve MER — Checked: 2026-10-22
- Triple Whale: What is marketing efficiency ratio (MER)? — Checked: 2026-10-22
- Google Ads: About Target ROAS bidding — Checked: 2026-10-22
- MeetROAS: Partner Event API — Checked: 2026-10-22